A Market Rotation Hits Technology Stocks, But Not Google
Technology’s powerful run hit a wall in November.
Media headlines warned of a potential AI bubble, and generally speaking, the best performing categories over the past year—Technology, Communication Services, and Utilities—lagged during the month.
The table below shows sector performance over the past month and the past year, and it’s clear to see how capital rotated from growth (Technology, Communication Services) to value (Health Care, Consumer Staples) last month.
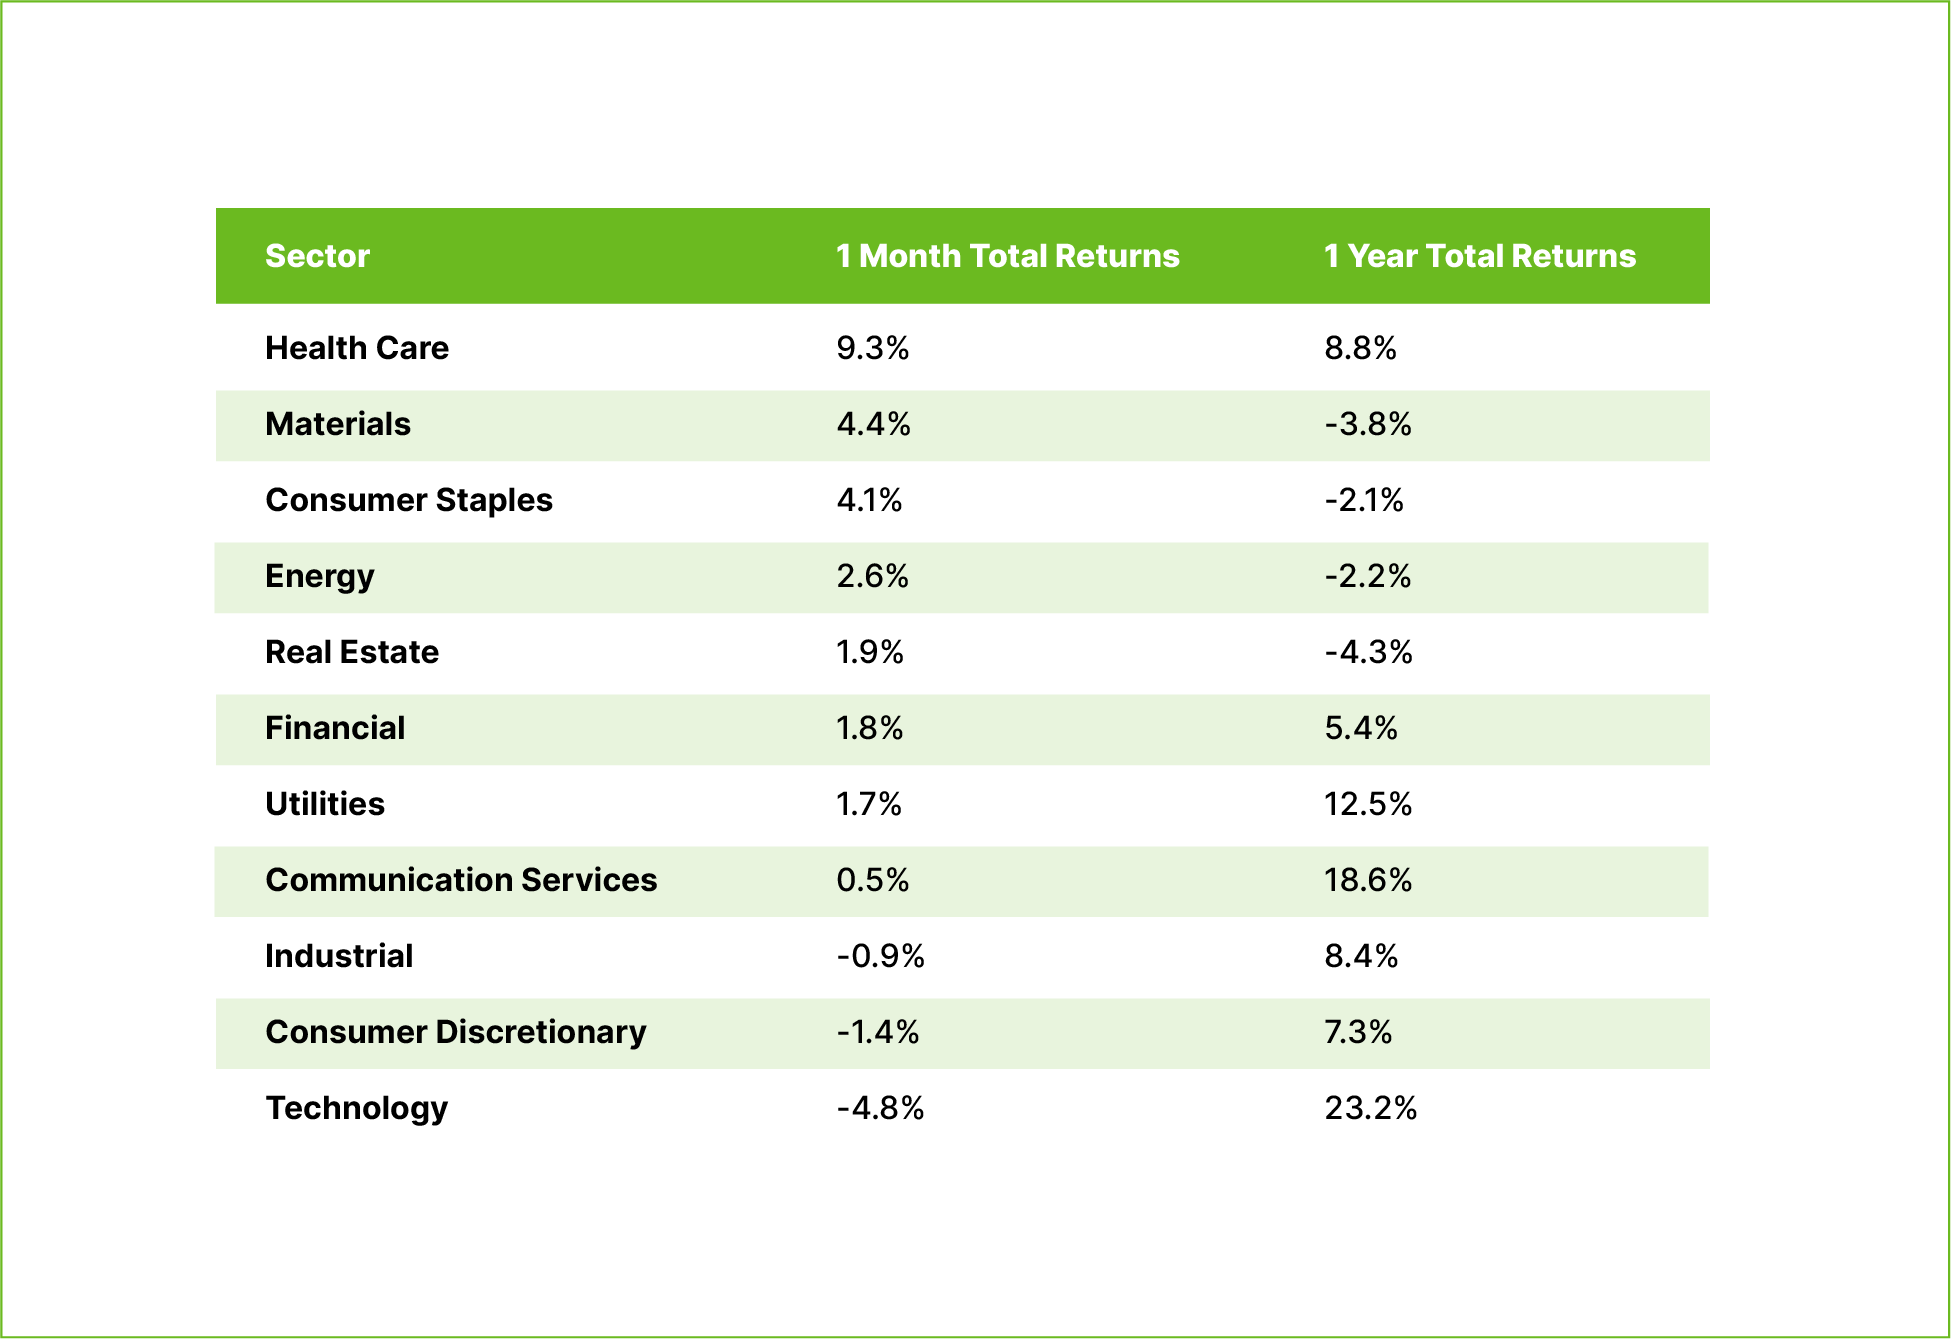
As we wrote in our early November note, we viewed this action as a normal correction and leadership rotation, especially given Technology’s consistent outperformance not only in total return, but also earnings growth.
In Core portfolios, our positions in Eli Lilly and Merck benefited from this rotation, posting strong gains to help neutralize selling pressure elsewhere.
But the most interesting feature of the market rotation, in our view, was the impact it didn’t have on shares of Alphabet (Google).


We see two key factors driving Google’s resilience at this point in the AI cycle, and we think it’s important to note that the company’s resilience reflects company-specific fundamentals—not a broader ‘immunity’ across mega-cap technology or AI-exposed stocks.
1 / Alphabet’s Core Business Remains Exceptionally Robust
Nearly 90% of global internet search traffic still runs through Google, giving the company unmatched reach and a distribution channel for new AI features that competitors simply cannot replicate. $385 billion in annual revenue–Google’s core business–comes from advertising.
Google’s massive user base has diluted Chat GPT’s first-mover advantage, as evidenced by Gemini’s (Google’s AI chat tool) rapid adoption. According to a survey by TD Cowen, Gemini’s usage has risen by 2% since July while ChatGPT’s has fallen over the same period.
2 / Alphabet’s Vertically-Integrated AI Strategy with the Balance Sheet to Support It.
Alphabet’s balance sheet is nothing short of astounding.
The company generated more than $150 billion in operating cash flow over the past year, which is the highest figure of any company in the S&P 500.
Alphabet’s ratio of cash to debt is far better than its peers in the industry. According to CreditSights, its combined debt and lease obligations amount to only 0.4 times pretax earnings—well below the 0.7 multiple observed at Microsoft and Meta.
Even after increasing capital expenditures by more than 70% this year, AI-related spending represents a far smaller share of revenue for Alphabet than for peers like Microsoft and Meta.
That’s the balance sheet piece.
Alphabet is also vertically integrated in its approach to AI. Unlike peers that rely heavily on external suppliers, Google designs and trains models on its own hardware (TPU chips), its own networks, and its own cloud infrastructure. In our view, this is a major competitive advantage.
The recently launched Gemini 3 model is a proof point: it was trained on Google-designed TPUs and delivered benchmark results strong enough to shift sentiment toward Google while raising competitive questions for others. Reports that Alphabet is approaching large cloud customers—including Meta—about licensing its chips added fuel to the story and highlighted Google’s ability to compete directly with major semiconductor providers like Nvidia.
Taken together, these factors—dominant distribution, rising AI adoption, vertical integration, and financial flexibility—help explain why Alphabet weathered the November rotation far better than most of its peers.
Notes and Disclaimers
This newsletter has been prepared solely for the client to whom it was directed and may not be sent to any other party. Further, it contains highly confidential and proprietary information and trade secrets that are of independent, economic value to us. Any disclosure of this information could cause us competitive harm. By accepting this newsletter, you agree to keep strictly confidential all of its contents and may not reproduce, distribute, share or publish in any manner without our prior written consent. This letter is not, and is not intended to be, an advertisement within the meaning of Advisers Act Rule 206(4)-1.
In preparing this newsletter, we have relied upon information provided by the custodian(s) and other third-party sources we believe to be reliable and accurate.
Past performance does not guarantee future results. Different types of investments involve varying degrees of risk and there can be no assurance that the future performance of any specific investment or investment strategy will be profitable. Changes in investment strategies, contributions or withdrawals, and economic and market conditions will materially alter the performance of your account. All investing involves risk of loss including the possible loss of all amounts invested.
Index Disclaimers
The benchmarks referenced are included to reflect the general trend of the markets during the periods indicated and are not intended to imply that the underlying returns were comparable to the market indices either in composition or element of risk. There are significant differences between client accounts and the indices herein including, but not limited to, risk profile, liquidity, volatility, and asset composition.
The S&P 500 Index is a capitalization-weighted index comprised of 500 stocks chosen for market size, liquidity and broad industry group representation within the U.S. economy. Index returns represent gross returns, and are provided to represent the investment environment during the time periods shown and are not covered by the report of the independent verifiers.