Second Quarter 2026 / Strategy Update and Market Overview

As a reminder of our ongoing commitment to keep you informed, your quarterly performance reports are available on our secure WestEnd Client Portal. You can access it anytime here: WestEnd Black Diamond Portal
If you need help logging in, contact us directly or visit this page for instructions: Client Login Information
________________
Note to clients: We are always open to feedback, suggestions, questions, concerns, or anything you would like to see us do differently. Please feel free to email your ideas anytime at info@wcmsf.com
In last quarter’s letter, we argued that the Iran war’s impact on the equity market seemed likely to diminish as time went on. We saw that play out in the second quarter, as stocks broadly rallied and crude oil prices fell in the wake of the ceasefire. WestEnd’s Core Strategy rose +16.3% net of fees in the three months ending June 30, outperforming the benchmark S&P 500. We also hold a considerable lead over the benchmark year-to-date.
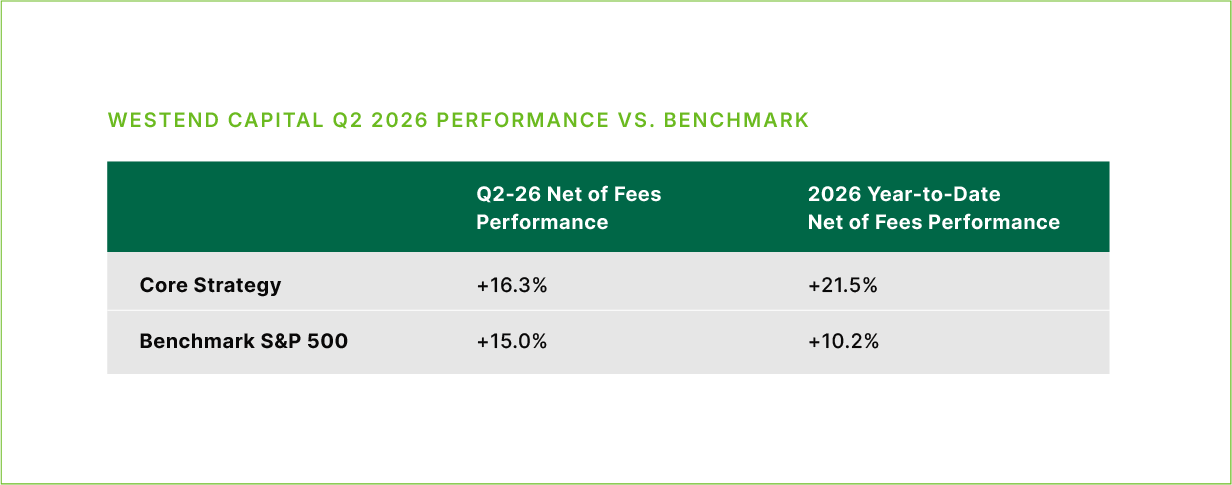
*Performance values as of June 30, 2026
Please note that these performance figures represent a weighted average of return for each strategy, based on a sampling of actual accounts. The accounts used to measure weighted average performance were generally portfolios that were invested for the entire quarter and were not subject to extraneous factors like scheduled withdrawals, account restrictions, and other factors. The weighted average was based on 131 Core portfolios. Actual performance results may differ from composite returns, depending on the size of the account, investment guidelines and/or restrictions, inception date and other factors. Please see the index disclaimers for the S&P 500 at the end of this review. Past performance is not indicative of future results.
Some investors may see a chaotic geopolitical situation and wonder how stocks are holding up so well. Explaining the dichotomy between the ‘vibe’ and stock prices is actually straightforward, in our view: earnings have continued to surprise to the upside, often by a lot.
First-quarter S&P 500 earnings grew more than 29% year-over-year, with second-quarter earnings currently expected to increase approximately 24%. Consensus estimates now project earnings growth approaching 27% for full-year 2026, continuing one of the strongest corporate profit cycles of the past decade. WestEnd has been fortunate to own some of the top earnings generators in the market, driving our strong performance results.
Among the largest contributors to total return in 2026 have been positions in ASML, Caterpillar, Freeport McMoran, Rockwell Automation, Howmet Aerospace, Kodiak Gas, Quanta Services, and Viking. The success stories are the same across the board—these companies are growing earnings at an accelerating pace, and they’re being rewarded for it.
In addition to strong results, upward earnings revisions have been a key driver of broader market enthusiasm. In earnings calls over the past few months, we’ve seen upward revisions spread across nearly every major sector, while the median company in the S&P 1500 is now generating double-digit earnings growth.
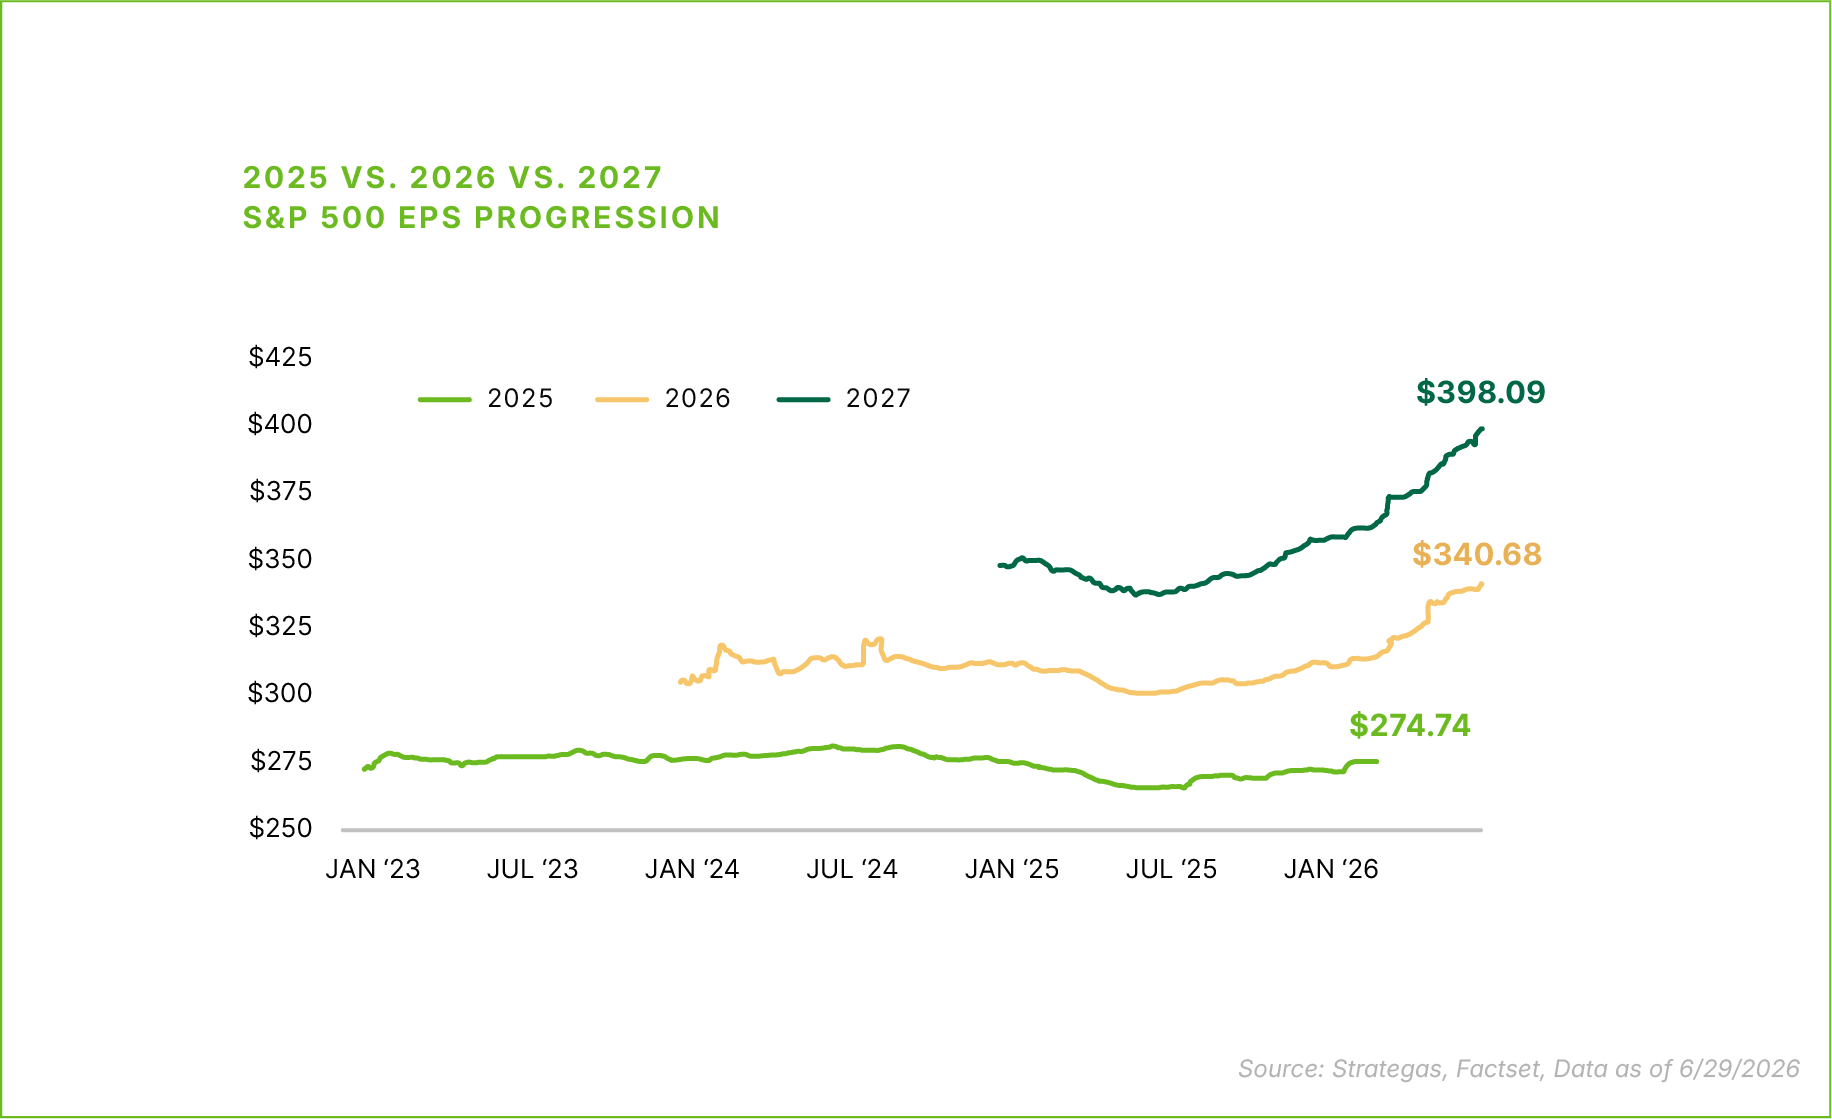
U.S. companies have become exceptionally efficient at converting sales into earnings. S&P 500 net profit margins reached 14.8% during the first quarter—the highest level in at least a decade—and are expected to remain above 14% in the second quarter despite higher interest rates, elevated investment spending, and renewed geopolitical uncertainty. In other words, companies are not simply growing revenue, they are preserving profitability at historically high levels.
Technology remains the most critical sector, with the many of the most compelling growth stories. It continues to represent a meaningful portion of WestEnd’s Core portfolio. But we also added exposure to businesses benefiting from long-term themes including infrastructure investment (Waterbridge), demographic change (Janus Living), financial innovation (Robinhood), and selective opportunities within the consumer economy (Restoration Hardware and Target).
We cover our thesis to own these names below.
WaterBridge Infrastructure

The Company’s Competitive Advantage
WaterBridge owns and operates the largest independent produced-water infrastructure network in the Delaware Basin, providing services that are essential to energy production throughout one of North America’s most productive oil basins.
The scale and density of this network would be extremely difficult and expensive to replicate. WaterBridge also generates most of its revenue through long-term contracts that include minimum-volume commitments and inflation-linked pricing.
Why We Like It
We believe WaterBridge is positioned to benefit from:
A meaningful increase in free cash flow
Greater capacity to grow its dividend
Additional flexibility for acquisitions and strategic investments
Improving returns on the infrastructure already developed
Our investment thesis is grounded in the company’s existing water infrastructure business, but we also see potential upside from growing industrial demand for water, including recycling and cooling requirements associated with large-scale AI data centers. We view that opportunity as incremental rather than essential to the thesis, providing another possible source of long-term earnings growth.
Janus Living

The Company’s Competitive Advantage
Janus Living is one of the nation's largest pure-play owners and operators of senior housing communities. Unlike traditional triple-net REITs that collect fixed lease payments, Janus generates operating income directly from resident rents and service fees. That means the company captures the full operational upside as occupancy and rental rates increase, while also assuming the operational risks of running its communities. Because residents pay privately rather than through Medicare or Medicaid reimbursement programs, the business is largely insulated from changes in government reimbursement policy.
The industry's long-term fundamentals remain compelling:
The U.S. population over age 85 is projected to grow roughly 60% by 2035, from approximately 7 million to 11 million people.
New senior housing construction remains well below historical levels, pushing occupancy back toward 90%.
The senior housing market is expected to grow from roughly $75 billion today to more than $100 billion by 2031, representing annual growth of approximately 6%.
Why We Like It
We believe Janus is well positioned to capitalize on these favorable industry dynamics. As a recently spun-out, pure-play operator, management is focused exclusively on growing within an attractive niche rather than competing for capital across multiple real estate sectors.
Our investment thesis is supported by several factors:
An under-levered balance sheet provides flexibility for accretive acquisitions.
Tight supply should continue supporting occupancy, rental-rate growth, and margins.
A strong public market debut, with first-quarter revenue up 35%, same-store adjusted NOI up 13.8%, and AFFO of $0.23 per share.
Like any REIT, Janus is sensitive to interest rates, labor costs, and housing market conditions. However, because demand for senior housing is largely need-driven rather than discretionary, we believe the company offers a relatively defensive earnings profile with an attractive runway for long-term growth.
Robinhood

The Company’s Competitive Advantage
Robinhood has evolved well beyond the online brokerage platform many investors still associate with its early years. The company is building a broader financial services ecosystem that includes brokerage and retirement accounts, cash management, securities lending, advisory services, credit products, prediction markets, and international operations.
But its primary advantage is the strength of its customer relationship. Robinhood has built a large, highly engaged user base and can introduce new products through a single digital platform with relatively low incremental distribution costs. As customers consolidate more of their financial activity with the company, Robinhood can generate higher revenue per account and develop recurring revenue streams that extend beyond transaction-based trading.
Why We Like It
We believe the market continues to underestimate Robinhood’s potential to become a diversified financial platform. Several developments support that view:
Assets under custody continue to grow.
Customers are adopting a wider range of products.
Revenue per account is increasing.
Revenue is growing faster than expenses, producing meaningful operating leverage.
New services are making the business less dependent on trading activity alone.
Trump accounts could open the door to a new generation of customers
While trading remains an important part of the business, we believe Robinhood’s growing product suite and deepening customer relationships provide multiple drivers of long-term value creation.
Restoration Hardware

The Company’s Competitive Advantage
RH has built one of the most distinctive luxury home brands in the industry. It serves a relatively affluent customer base that has remained more resilient than the broader consumer despite higher interest rates and several years of elevated inflation. As we discussed earlier, today's economy is increasingly characterized by a "K-shaped" consumer, with higher-income households continuing to spend on discretionary purchases while lower-income consumers remain more sensitive to rising costs.
Management has continued strengthening the RH brand through new galleries, expanded collections, hospitality offerings, and international development, extending the company well beyond a conventional home-furnishings retailer.
Why We Like It
Elevated mortgage rates and historically low housing turnover have weighed on demand across the home-furnishings industry, while RH’s continued investment has also pressured near-term profitability. We believe those conditions have obscured the company’s longer-term earnings potential.
RH is positioned to benefit from several potential earnings drivers:
An eventual recovery in housing transactions
Stronger demand for home furnishings as homeowners move and renovate
Operating leverage on investments already being made
International expansion
Growth in adjacent products, services, and hospitality concepts
Target

The Company’s Competitive Advantage
Target’s competitive advantage begins with its national store footprint, recognized brand, loyal customer base, and ability to integrate physical retail with digital shopping and same-day fulfillment.
The company excels in offering convenience across shopping channels, while using its scale to support merchandising, inventory management, and fulfillment capabilities.
Why We Like It
Target has spent the past several years navigating excess inventories, changing consumer preferences, elevated freight costs, and inflation-related shifts in spending. At the same time, the company has continued investing in stores, digital capabilities, and its fulfillment network.
We believe several factors could support stronger earnings:
Improved inventory management
Better operational execution
More normalized freight and supply-chain costs
Stabilizing consumer purchasing patterns
Margin recovery
Increased productivity from prior investments in stores and fulfillment

Finally, a Note Regarding the SpaceX IPO
One of the more interesting investment decisions we made during the quarter involved a company we greatly admire, but ultimately chose not to own: SpaceX.
There is little debate that SpaceX has built one of the world's most remarkable businesses. Starlink has become the global leader in satellite internet connectivity, the company's launch operations continue to redefine commercial space transportation, and its growing investments in artificial intelligence and digital infrastructure present additional long-term opportunities. By almost any measure, SpaceX is an extraordinary company.
Our decision not to participate in the IPO was not a reflection of the business itself. Rather, it reflected our assessment of valuation and expected future returns.
At its anticipated valuation, we believe much of SpaceX's long-term growth potential was already reflected in the offering price. The company's opportunities remain significant, but so do the capital requirements necessary to realize them. While we expect SpaceX to remain an exceptional business for years to come, we believe successful investing requires balancing business quality with the price paid to own that business.
Rather than allocating additional capital to one of the market's highest-profile offerings, we continued building positions in businesses where we believe long-term earnings growth, free cash flow generation, and valuation combine to create more compelling risk-adjusted return opportunities.
Notes and Disclaimers
This newsletter has been prepared solely for the client to whom it was directed and may not be sent to any other party. Further, it contains highly confidential and proprietary information and trade secrets that are of independent, economic value to us. Any disclosure of this information could cause us competitive harm. By accepting this newsletter, you agree to keep strictly confidential all of its contents and may not reproduce, distribute, share or publish in any manner without our prior written consent. This letter is not, and is not intended to be, an advertisement within the meaning of Advisers Act Rule 206(4)-1.
Further, a substantial part of this newsletter contains forward-looking statements within the meaning of the federal securities laws, including in particular statements appearing on page 3. Forward-looking statements are those that predict or describe future events or trends and that do not relate solely to historical matters. For example, forward-looking statements may predict future economic performance, describe plans and objectives of management for future operations and make projections of revenue, investment returns or other financial items. A prospective investor can generally identify forward-looking statements as statements containing the words “will,” “believe,” “expect,” “anticipate,” “intend,” “contemplate,” “estimate,” “assume” or other similar expressions. Such forward-looking statements are inherently uncertain, because the matters they describe are subject to known (and unknown) risks, uncertainties and other unpredictable factors that are beyond our control. Actual results could and likely will differ, sometimes materially, from those projected or anticipated. We are not undertaking any obligation to update or revise any forward-looking statements whether as a result of new information, future events or otherwise. You should not take any statements regarding past trends as a representation those trends or activities will continue in the future. Accordingly, you should not put undue reliance on these statements.
In preparing this newsletter, we have relied upon information provided by the custodian(s) and other third-party sources we believe to be reliable and accurate.
Past performance does not guarantee future results. Different types of investments involve varying degrees of risk and there can be no assurance that the future performance of any specific investment or investment strategy will be profitable. Changes in investment strategies, contributions or withdrawals, and economic and market conditions will materially alter the performance of your account. All investing involves risk of loss including the possible loss of all amounts invested.
Index Disclaimers
The benchmarks referenced are included to reflect the general trend of the markets during the periods indicated and are not intended to imply that the underlying returns were comparable to the market indices either in composition or element of risk. There are significant differences between client accounts and the indices herein including, but not limited to, risk profile, liquidity, volatility, and asset composition.
The S&P 500 Index is a capitalization-weighted index comprised of 500 stocks chosen for market size, liquidity and broad industry group representation within the U.S. economy. Index returns represent gross returns, and are provided to represent the investment environment during the time periods shown and are not covered by the report of the independent verifiers.